Oct 2026· GRACE/GRACE-FO Science Team Meeting 2026· 0 citations
Abstract
We report the successful deployment of a Sonardyne Fetch AZA ocean bottom pressure recorder at the Oceanographic Weather Station M (66°N, 2°E) in the Nordic Seas in June 2026. The deployment and data recovery efforts are supported by NASA's GRACE-FO Science Team and the University of Bergen, with the goal of providing an independent, long-term in situ record for the validation and interpretation of satellite gravimetry observations. The instrument was deployed at approximately 2,034 m depth, about 2 km west of the long-term physical oceanographic mooring at Station M, and is recording hourly ocean bottom pressure and temperature. The instrument is equipped with batteries designed to support up to 10 years of operation and an acoustic transducer that enables data to be retrieved remotely from the surface without recovering or disturbing the instrument on the seafloor. A key capability of the Fetch AZA is its in situ self-calibration system, which enables characterization and correction of long-term pressure-sensor drift – a major limitation of conventional bottom pressure records for resolving low-frequency ocean mass variability. An initial data harvest approximately 11 hours after deployment successfully recovered the first measurements and confirmed proper instrument operation. Strong acoustic communications were also established from multiple ranging locations approximately 1 km from the triangulated instrument position, demonstrating the feasibility of future acoustic data recovery. Annual data recovery is planned to build a multi-year, drift-corrected ocean bottom pressure record for comparison with GRACE-FO and future GRACE-C and NGGM observations, and for validation and improvement of their data products.
In November 2021, the Canadian National Facility for Seismological Investigations launched its first long-term test of the new Güralp Aquarius broadband ocean-bottom seismometers (OBS). The study targeted the lower Laurentian Fan seismic zone (∼4.5 km water depth), a seismically active zone of oceanic lithosphere dow...
Elahe Sirati, A. Plourde, M. Nedimović et al.· Seismological Research Lette...· 0 citations
Despite improvements from the GOT5.6 ocean tide model adopted for RL07 processing, tide model error remains a significant source of temporal aliasing in GRACE gravimetry. This effect is felt particularly in shallow shelves with complex bathymetry and a larger than normal presence of nonlinear tides, as well as in regio...
Nicholas A. Childress, S. Bettadpur, H. Save et al.· GRACE/GRACE-FO Science Team...· 0 citations
We previously produced the local ensemble transform Kalman filter (LETKF)-based Ocean Research Analysis (LORA) version 1.0 datasets for the western North Pacific and Maritime Continent regions (LORA-WNP and LORA-MC, respectively) during the period from August 2015 to January 2024. However, these limited domains and per...
Shun Ohishi, T. Miyoshi, M. Kachi· Ocean Science (OS)· 0 citations
This article describes an ocean-bottom seismic data set collected offshore New Zealand’s North Island as part of a multinational amphibious experiment investigating the Auckland volcanic field. From August 2023 to September 2024, 20 broadband ocean-bottom seismographs were deployed at water depths of 1200–2700 m, yie...
Jun-Guo Lin, Ting Yang, Zong-Shan Li et al.· Seismological Research Lette...· 0 citations
The cooling of surface water in coastal seas is routinely detected by surface sensors, but a surface record alone cannot show whether the water below cooled at the same time or instead became warmer, and the two patterns may arise from different physical processes. We examined temperature records from seven coastal buo...
H. Jung, Hyesook Lee, Hu-Sun Im et al.· Journal of Marine Science an...· 0 citations
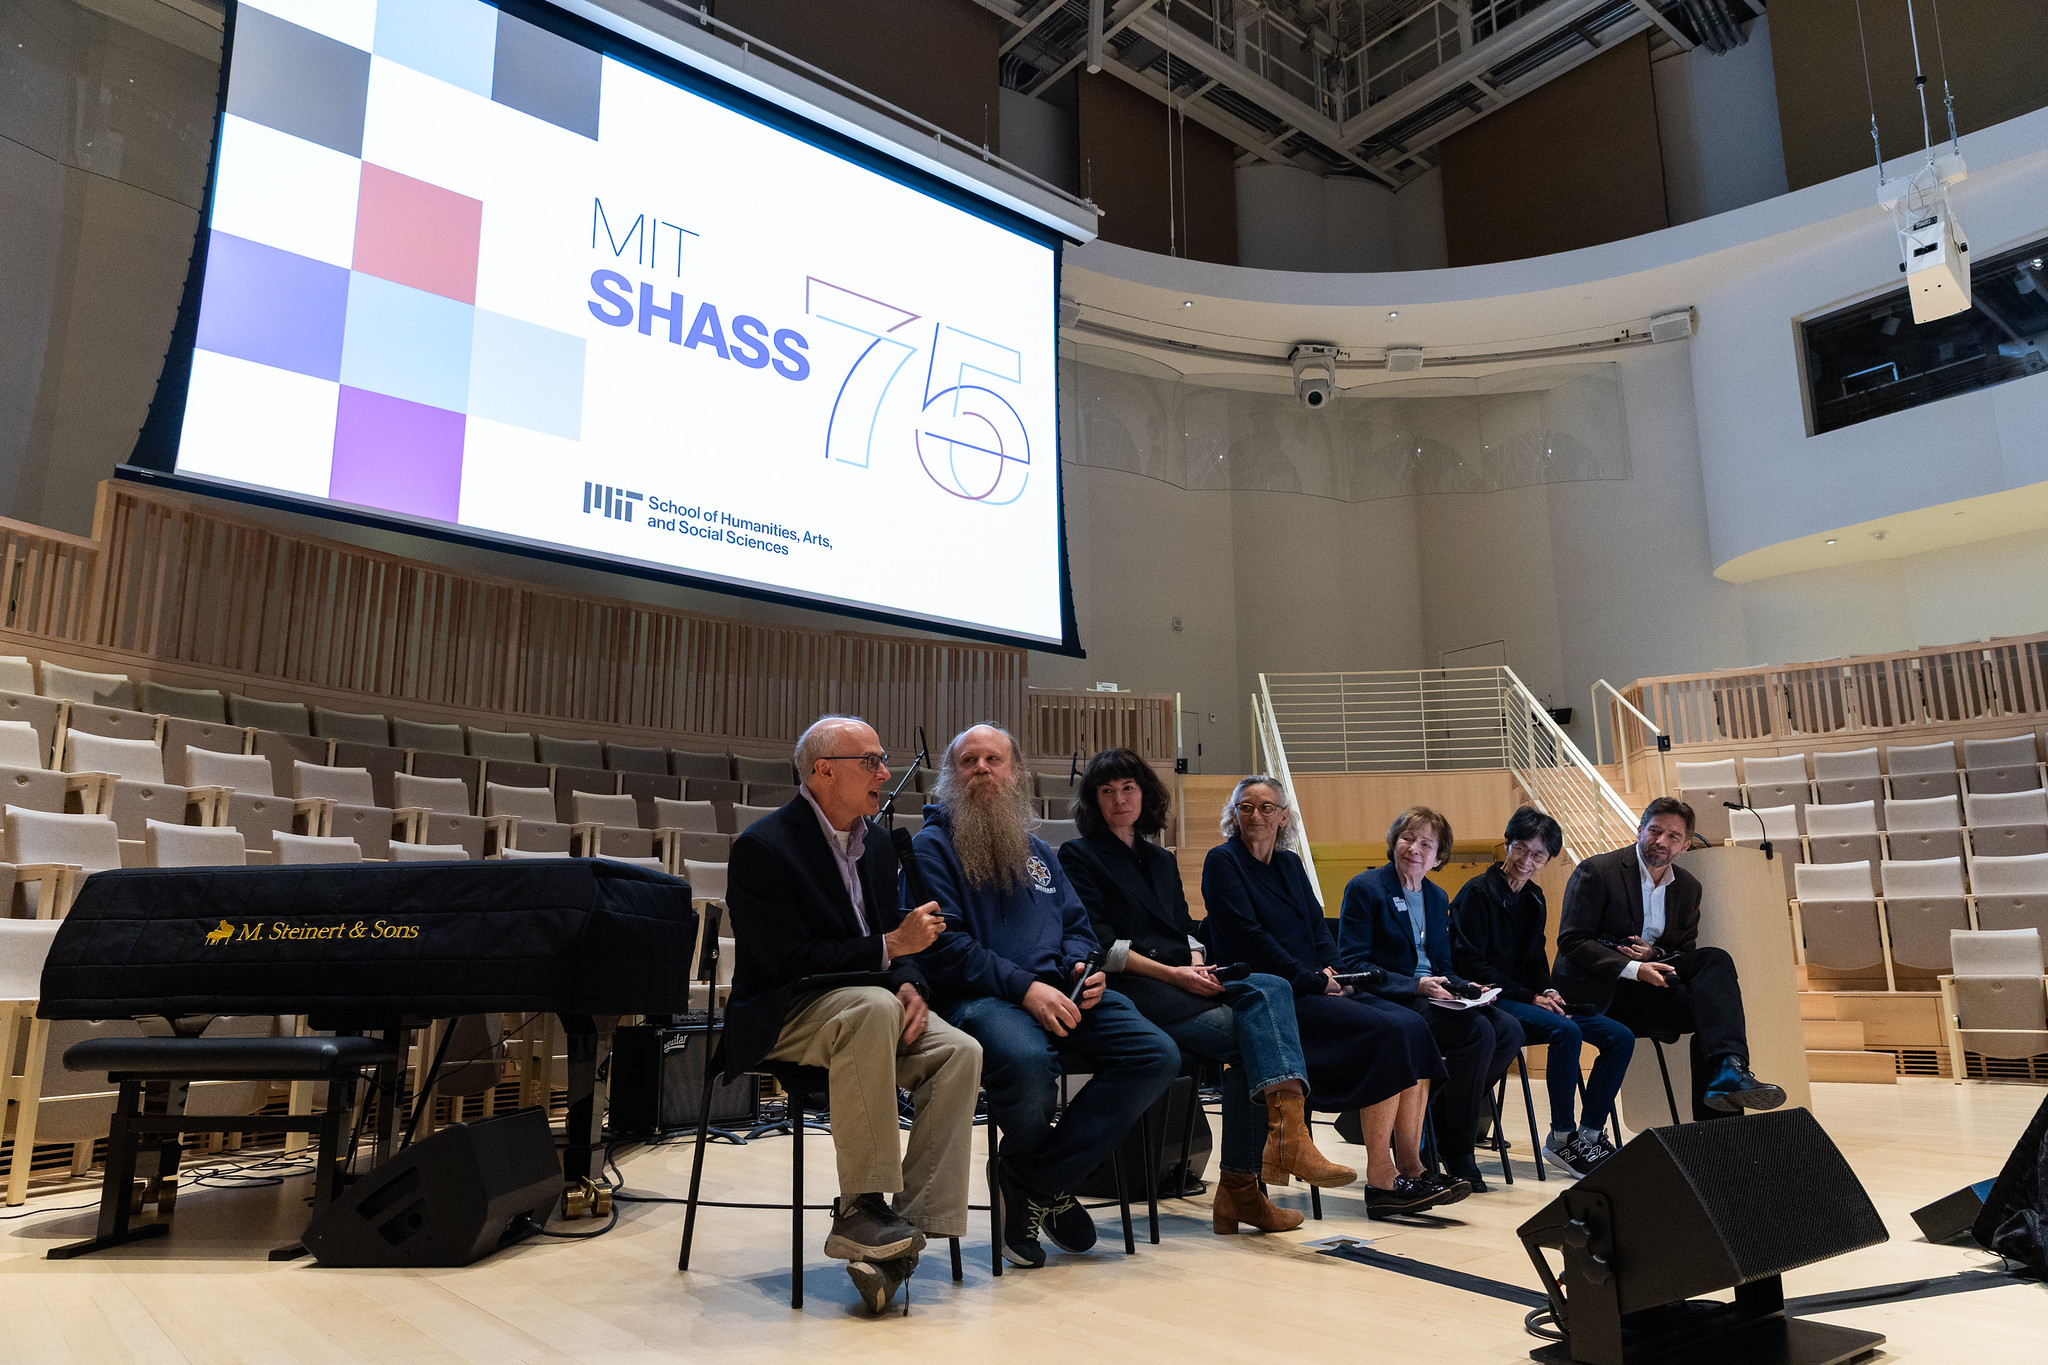
During the School of Humanities, Arts, and Social Sciences’ 75th Anniversary Symposium, President Sally Kornbluth said “MIT has never needed your particular insight and guidance more than we do now.”
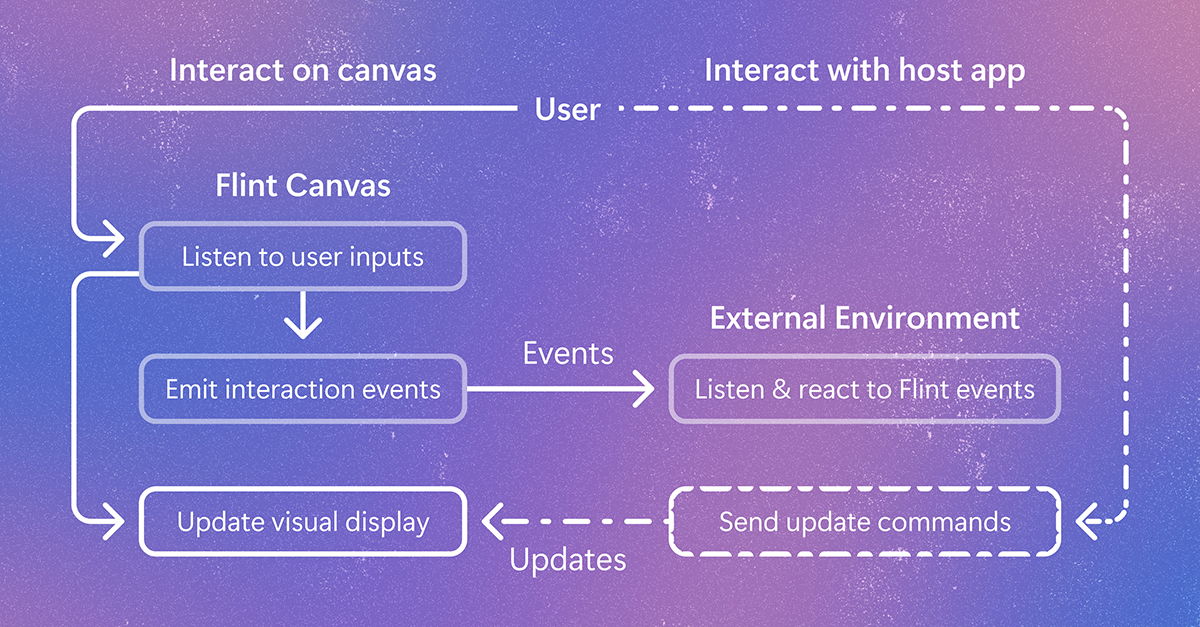
Flint-interactive gives AI agents a language for creating interactive visualizations. Click a chart, filter data, highlight related content, and explore beyond the view the author originally chose. The post Flint-interactive: A language for creating interactive data visualizations appeared first on Microsoft Research.
We use cookies to run the site and, with your consent, for analytics and to show ads.
See our Cookie Policy.