Baseline Exposure to Common Data Visualization Types Among the U.S. Adult Population
Kiegan RiceNola du ToitQuentin BrummetHeike Hofmann
Oct 2026
Human-computer Interaction
Abstract
Data visualizations are a primary means of communicating statistical information to the public. Their expanding use across news media, public health, education, and government reporting places greater importance on audiences' ability to recognize and interpret them. While a significant body of prior research has established frameworks for the measurement of graph and visualization literacy, far less is known about everyday exposure to different kinds of charts and graphs among the general adult population. This gap limits our ability to meaningfully interpret differences in graph literacy, focus efforts on improving that literacy, and design visualizations that align with audience ability. Establishing population level estimates of exposure to data visualizations is therefore essential for improving visual communication and reducing misinterpretation of quantitative information. To address this gap, we surveyed a nationally representative sample of 1,168 U.S. adults via NORC's AmeriSpeak panel about their exposure to sixteen different common data visualization types. The resulting survey responses demonstrate pronounced differences in baseline exposure to data visualizations across chart types and demographic groups. While widely used formats such as bar, pie, line, and grouped bar charts are highly recognizable to the vast majority of U.S. adults, many other practitioner-favored chart types remain unfamiliar to substantial portions of the adult population. Exposure also differs significantly by age and education, with higher educational attainment linked to greater exposure and older adults reporting lower exposure overall. Our findings provide essential population level context on visualization literacy and underscore the importance of aligning data visualization design with audience exposure and experience.
This publication proposes a definition and a classification of agile software development approaches and analyses ten software development methods that can be characterized as being "agile" against the defined criterion.
P. Abrahamsson, O. Salo, Jussi Ronkainen et al.· arXiv.org· 727 citations· ⚡54
The study shows that agile practices improve both informal and formal communication, but indicates that, in larger development situations involving multiple external stakeholders, a mismatch of adequate communication mechanisms can sometimes even hinder the communication.
M. Pikkarainen, Jukka Haikara, O. Salo et al.· Empirical Software Engineeri...· 401 citations· ⚡48
The results indicate that software engineering work practices are chosen opportunistically, adapted and configured to provide value under the constrains imposed by the startup context.
Nicolò Paternoster, Carmine Giardino, M. Unterkalmsteiner et al.· Information and Software Tec...· 394 citations· ⚡54
The perception of the impact of agile methods is predominantly positive, and several challenge areas were discovered, but based on this study, agile methods are here to stay.
M. Laanti, O. Salo, P. Abrahamsson· Information and Software Tec...· 260 citations· ⚡20
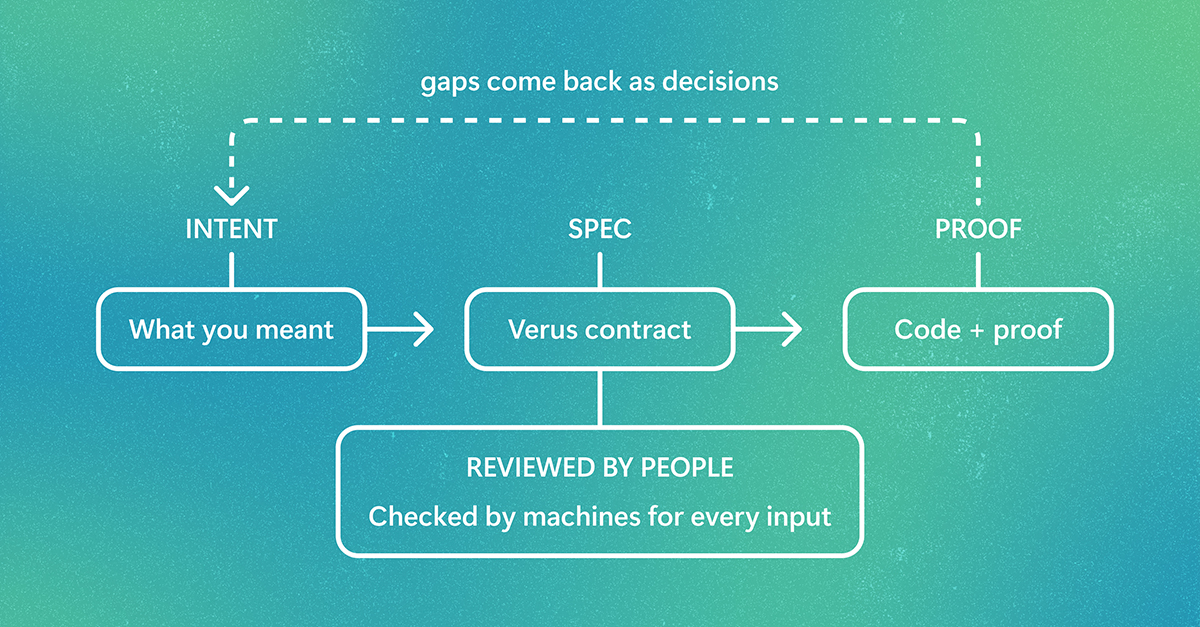
AI agents can generate code at a scale that’s hard for humans to review line-by-line. PDD Kit helps ensure the code is doing what the developer intended by creating formal specifications and testing against them. It converts developer intent into a Verus specification, proves AI-generated code meets it for every input, and uses tests where proofs aren't practical. Developers review intent, not every line. The post Formally verifying agent-written full-stack web apps with PDD Kit appeared first o…
Professor Paris Smaragdis develops computers with superhuman hearing for applications like speech recognition, music understanding, and environmental monitoring.
MIT News · Artificial Intelligence· news.mit.eduOct 23, 2026
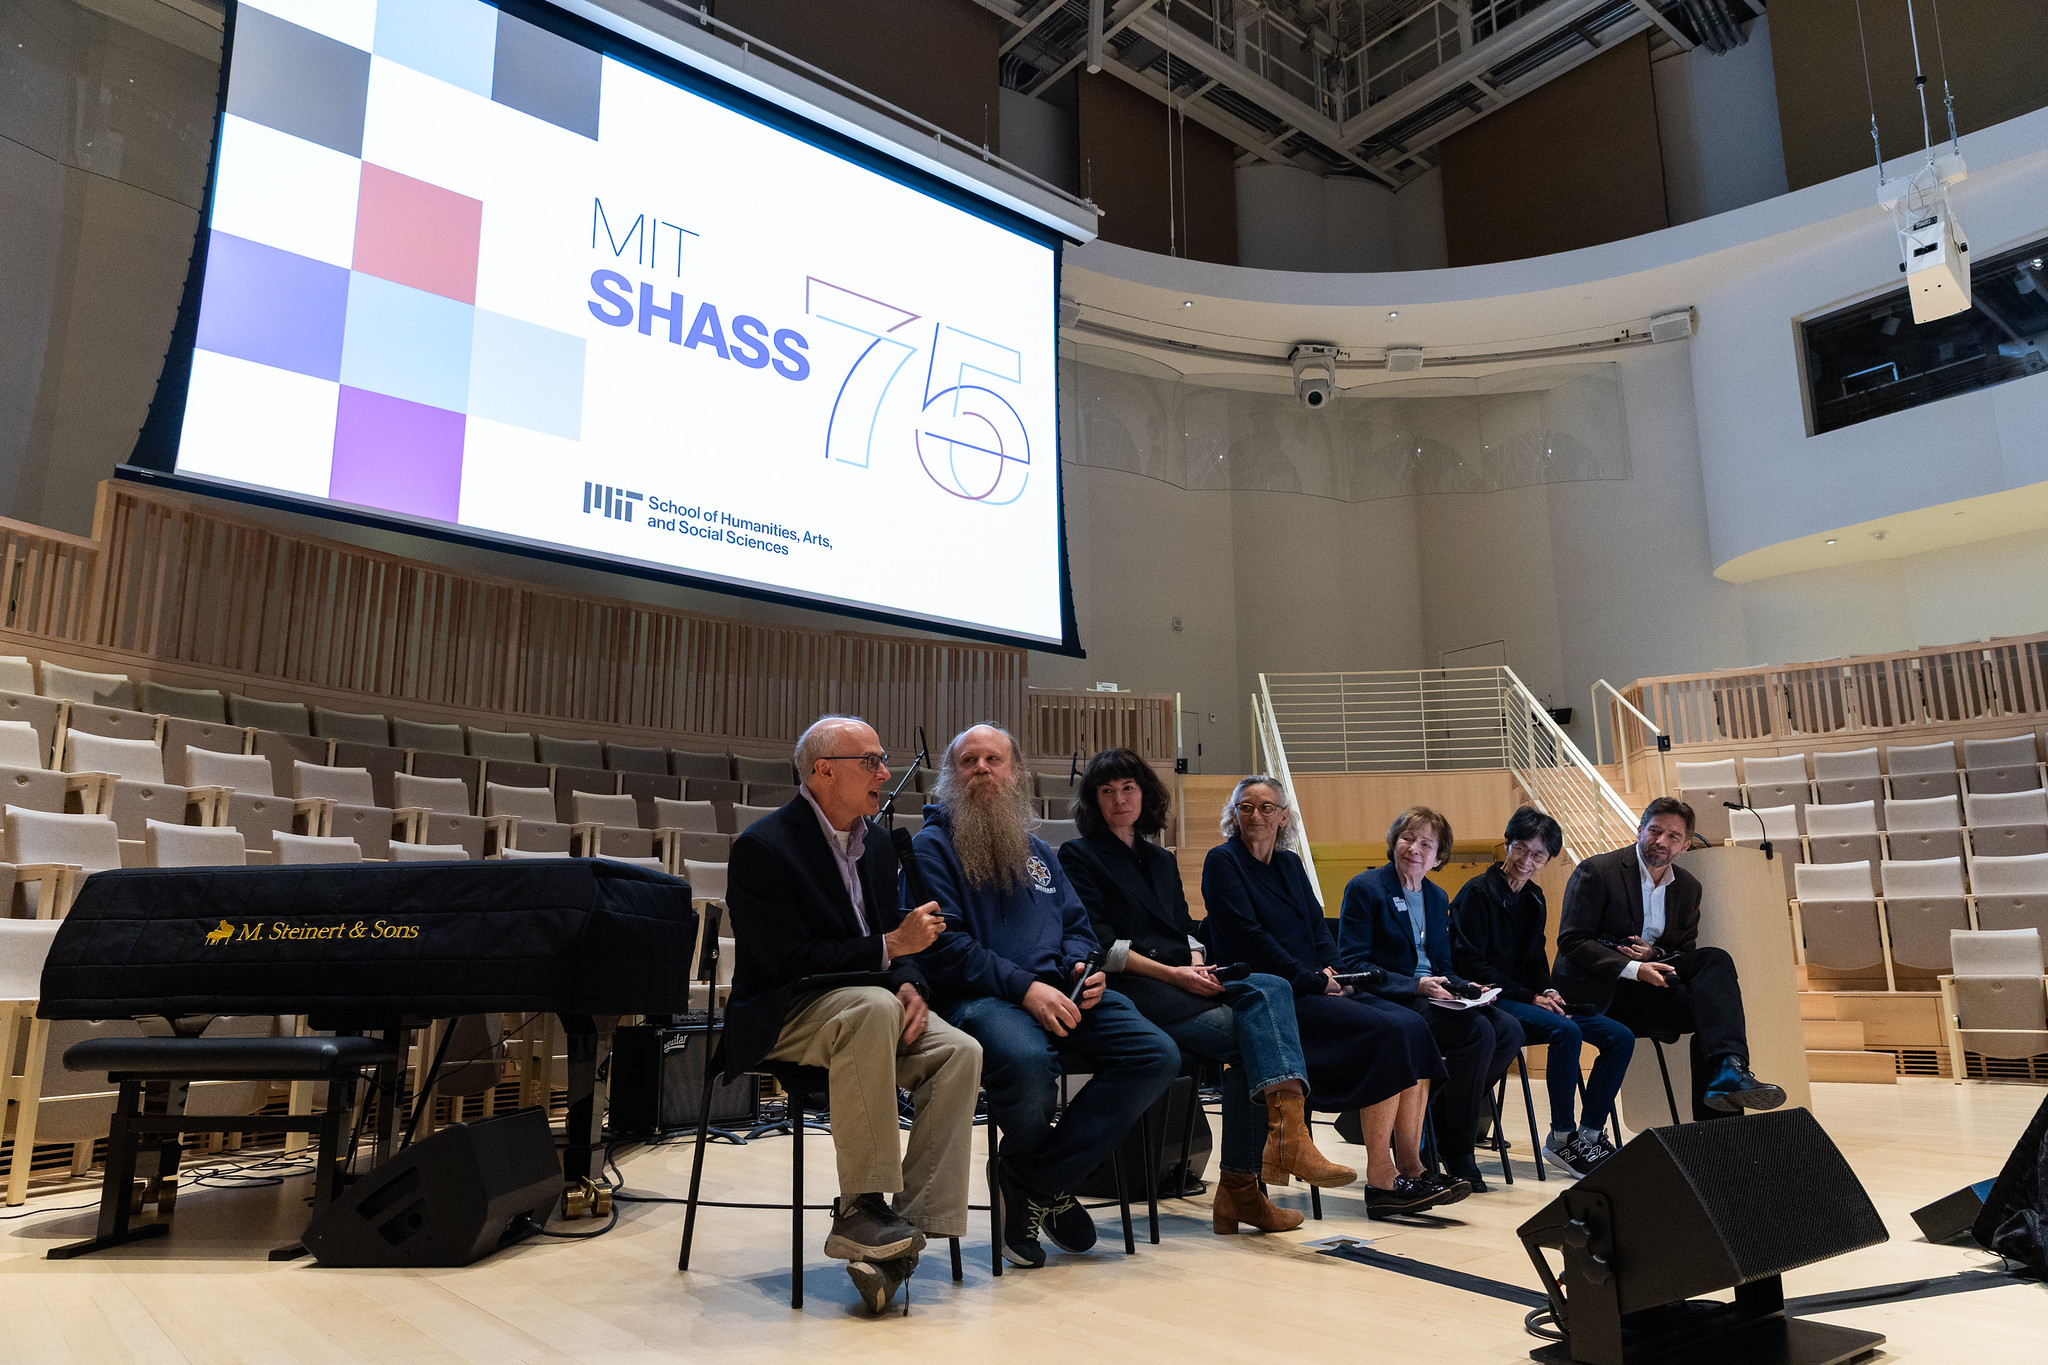
During the School of Humanities, Arts, and Social Sciences’ 75th Anniversary Symposium, President Sally Kornbluth said “MIT has never needed your particular insight and guidance more than we do now.”
We use cookies to run the site and, with your consent, for analytics and to show ads.
See our Cookie Policy.