Oct 2026· Zenodo (CERN European Organization for Nuclear Research)
Digital Games and Media
Abstract
Grenade use in professional Counter-Strike follows community conventions written neither in the game's rules nor in its physics. We present an annotation schema for utility lineups, defined by an origin zone, a landing zone and a grenade type, and a de_dust2 lineup dataset built from 69,827 throws in 122 professional matches of the ESTA dataset. Four fields are computed without human input; three of them were tested against criteria registered before they were derived. Geometry and frequency are usable with stated limits. Generality met its registered criterion for being unusable (rho_MM = -0.217, p = 7.1e-5, 330 lineups) and is not used. Difficulty passed its gate on bucket count but failed its main test: the tier gap was -0.98 with a 95% cluster bootstrap interval of [-6.68, 2.94], so it is reported only as a description. The purpose of a throw (intent) and whether it is conventional are left to human annotators. We pre-register a test of whether a panel of large language models could replace them. Three experienced players and at least three vision-capable models will label the same 100 stimuli under identical instructions. Krippendorff's alpha with item-bootstrap intervals will be judged against thresholds of 0.5 and 0.7 through five branches with a fixed verdict order. We report the full registration history, including revisions that did not only tighten the plan and an AI-filled label file that was never used. No human label exists yet. Results will appear in a later version.

The results are packaged in the Greenfield Startup Model (GSM), which explains the priority of startups to release the product as quickly as possible, and the need to shorten time-to-market, by speeding up the development through low-precision engineering activities.
Carmine Giardino, Nicolò Paternoster, M. Unterkalmsteiner et al.· IEEE Transactions on Softwar...· 178 citations· ⚡14
Software startup companies develop innovative, software-intensive products within limited timeframes and with few resources, searching for sustainable and scalable business models.
M. Unterkalmsteiner, P. Abrahamsson, Xiaofeng Wang et al.· e-Informatica Software Engin...· 157 citations· ⚡17
This study conducts a case survey study based on the secondary data of the major pivots happened in 49 software startups, and demonstrates that customer need pivot is the most common among all pivot types.
Sohaib Shahid Bajwa, Xiaofeng Wang, Anh Nguyen-Duc et al.· Empirical Software Engineeri...· 127 citations· ⚡15
The comparison of adopter and non-adopter sample reveals three potential adoption inhibitor, security, data privacy, and portability, which underlines the importance of the technical and security perspectives for research investigating the adoption of technology.
Nattakarn Phaphoom, Xiaofeng Wang, S. Samuel et al.· Journal of Systems and Softw...· 111 citations· ⚡8
The ongoing work building a Raspberry Pi cluster consisting of 300 nodes is presented, with potential use cases being an inexpensive and green test bed for cloud computing research and a robust and mobile data center for operating in adverse environments.
P. Abrahamsson, S. Helmer, Nattakarn Phaphoom et al.· IEEE International Conferenc...· 110 citations· ⚡7
The findings show that speed related agile practices are used to a greater extent in comparison to quality practices, and that software startups who adopt the Lean Startup approach do not sacrifice quality for speed more than other startups do.
Jevgenija Pantiuchina, Marco Mondini, Dron Khanna et al.· International Conference on...· 84 citations· ⚡4
Assistant Professor Benjamin Lindquist studies how engineers deliberately injected randomness into early AI, giving rise to deep-learning models that sometimes hallucinate.
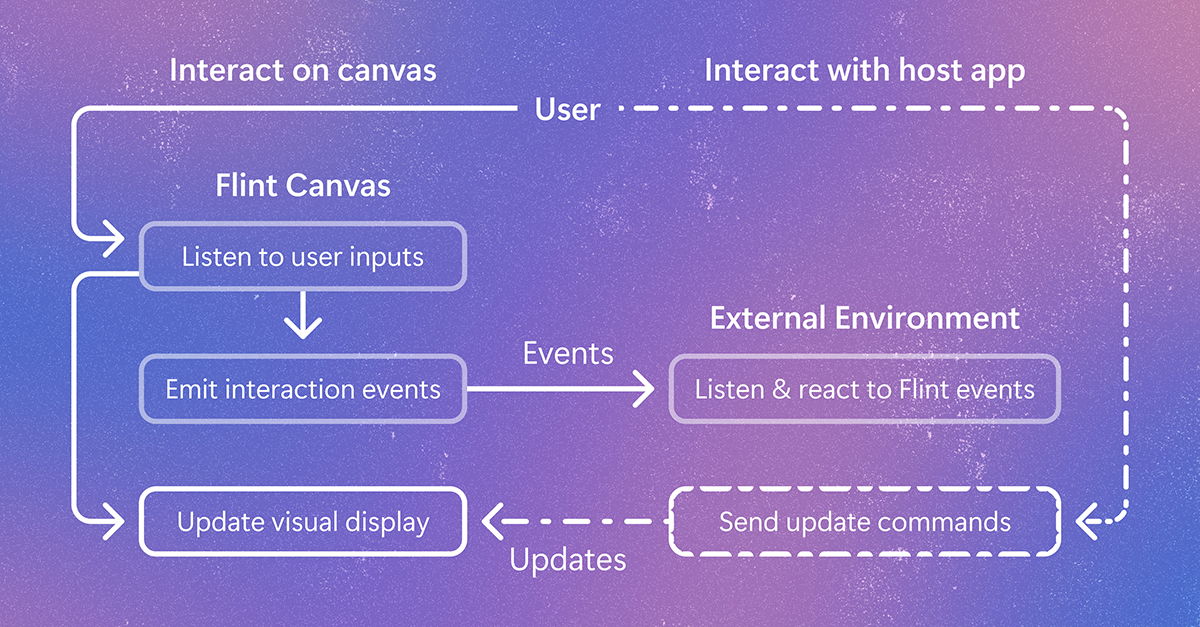
Flint-interactive gives AI agents a language for creating interactive visualizations. Click a chart, filter data, highlight related content, and explore beyond the view the author originally chose. The post Flint-interactive: A language for creating interactive data visualizations appeared first on Microsoft Research.
We use cookies to run the site and, with your consent, for analytics and to show ads.
See our Cookie Policy.