This narrative review synthesizes recent advances across radiography, computed tomography (CT), and magnetic resonance imaging (MRI), focusing on AI-driven methods for automatic extraction of bone quality markers.
INTRODUCTION
Reduced bone mineral density and degeneration of bone microarchitecture are hallmarks of Osteoporosis, a degenerative skeletal condition that raises the risk of fractures. Due to the subjective nature of conventional radiography assessment and the potential for inter-observer variability, early diagnosis a...
J. Harikiran, S. Kishan, Rama Seshagiri Rao Channapragada et al.· Computational biology and ch...· 0 citations
It is demonstrated that opportunistic osteoporosis screening from routine hip radiographs, combined with domain-aware preprocessing and transfer learning, can potentially provide a scalable and cost-effective alternative for wider osteoporosis risk stratification in resource-limited settings.
Charisa Areewattana, Suphachok Buaruk, N. Charatcharoenwitthaya et al.· 0 citations
ABSTRACT Bisphosphonates remain the pharmacological standard of care for osteoporosis; however, their clinical efficacy is limited by significant diagnostic gaps, heterogeneous therapeutic responses, and persistent concerns regarding long‐term safety, including medication‐related osteonecrosis of the jaw (MRONJ) and at...
It is indicated that AI can achieve high diagnostic accuracy in controlled, often single-centre retrospective settings, but its performance consistently declines for mild fractures, degenerated spines, and postoperative anatomy.
Zhi-Min Li, Cheng-An Tang, Pei-Bo Feng et al.· Frontiers in Medicine· 0 citations
Related blog posts
MIT News · Artificial Intelligence· news.mit.eduOct 23, 2026
Assistant Professor Benjamin Lindquist studies how engineers deliberately injected randomness into early AI, giving rise to deep-learning models that sometimes hallucinate.
Microsoft Research Blog· microsoft.comOct 22, 2026
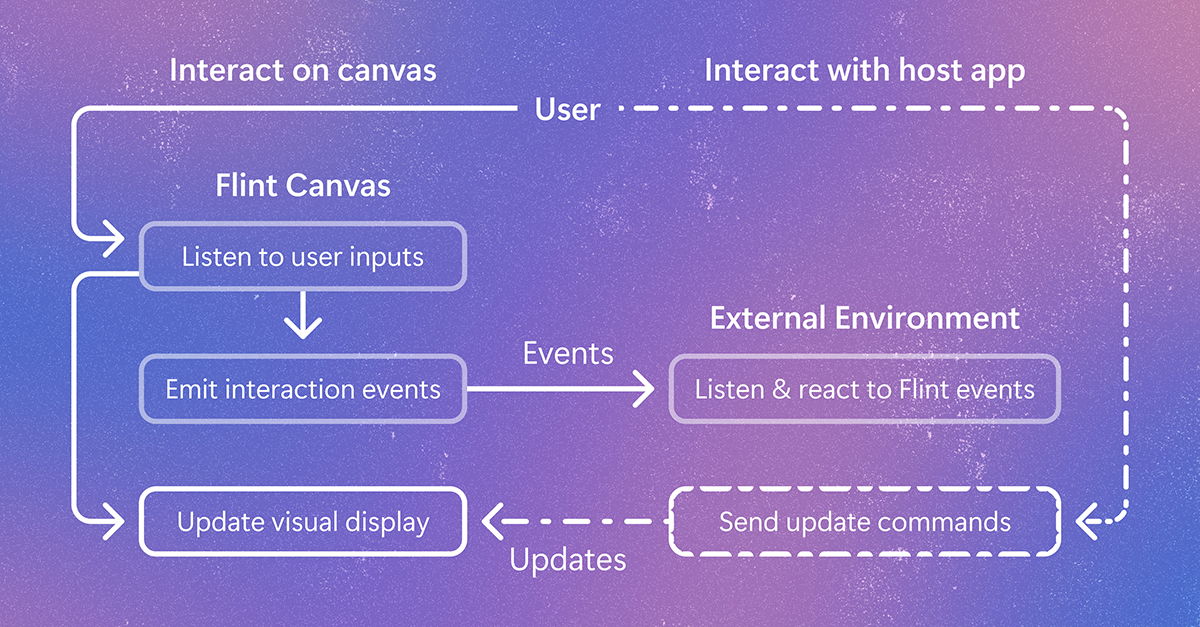
Flint-interactive gives AI agents a language for creating interactive visualizations. Click a chart, filter data, highlight related content, and explore beyond the view the author originally chose. The post Flint-interactive: A language for creating interactive data visualizations appeared first on Microsoft Research.