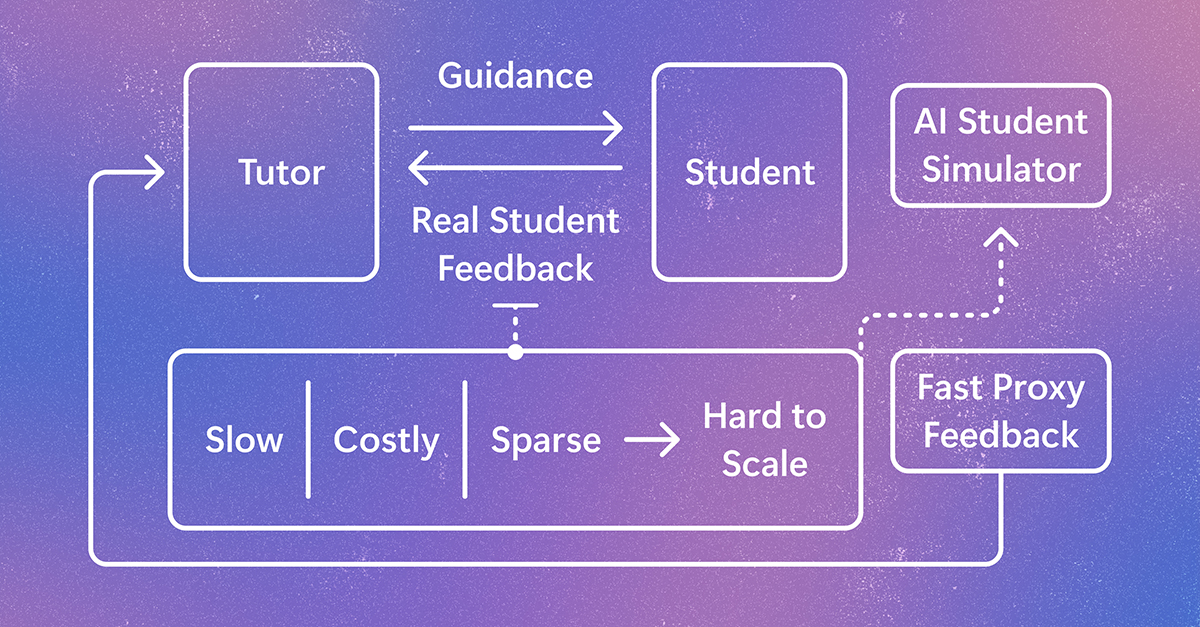
PolyFlow is a neural-symbolic framework for statically reasoning about information flow across language boundaries, combining large language models (LLMs) and static analysis synergistically, and is cost-effective and superior to various kinds of state-of-the-art baselines.
Haoran Yang, Zhi-Xuan Zhong, Jiawei Guo et al.· 0 citations
MERFISH MultiCSV DotPlot is a lightweight Python utility for generating dot-plot style summary figures from multiple MERFISH cell-by-gene CSV datasets and multiple selected genes. Each input CSV is represented as one column and each selected gene as one row. Dot size represents the fraction of cells with expression greater than a user-defined positive-cell threshold. Dot color can represent either absolute mean expression or per-gene relative mean expression scaled from 0 to 1 across the supplied datasets. The software accepts an arbitrary number of MERFISH CSV files and an arbitrary number of genes. It exports both publication-style figures and a long-format numerical summary table. Two color modes are available:- "absolute": dot color represents mean expression on the original input scale.- "gene_scaled": mean expression is independently scaled from 0 to 1 for each gene across the supplied datasets, emphasizing relative expression patterns between datasets. Positive cells are defined as:expression > positive_threshold The positive-cell threshold is explicitly specified by the user because appropriate thresholds depend on the expression scale and preprocessing of the input data. No automatic log/linear transformation is performed. Expression values are used exactly as supplied in the input CSV files.Input CSV format: Each CSV should contain one cell per row and gene-expression values in gene-named columns. Additional metadata or coordinate columns (e.g., cell ID, x, y, z, section information) may also be included. All genes selected for plotting must be present as numeric columns in every input CSV. The software was functionally validated using MERFISH-derived cell-by-gene datasets with multiple cell populations and genes. Expected qualitative differences between canonical D1- and D2-associated gene-expression patterns were reproduced during validation. No third-party MERFISH dataset is distributed with this software. Generative AI (ChatGPT, OpenAI) was used to assist with code generation, refinement, testing, packaging, and documentation. The concept, intended scientific use, validation, and final responsibility for the software remain with the author.
Sora Mitamura· Zenodo (CERN European Organi...· 0 citations
Reach audiences
Advertise in front of researchers, engineers, and readers.
MERFISH MultiCSV DotPlot is a lightweight Python utility for generating dot-plot style summary figures from multiple MERFISH cell-by-gene CSV datasets and multiple selected genes. Each input CSV is represented as one column and each selected gene as one row. Dot size represents the fraction of cells with expression greater than a user-defined positive-cell threshold. Dot color can represent either absolute mean expression or per-gene relative mean expression scaled from 0 to 1 across the supplied datasets. The software accepts an arbitrary number of MERFISH CSV files and an arbitrary number of genes. It exports both publication-style figures and a long-format numerical summary table. Two color modes are available:- "absolute": dot color represents mean expression on the original input scale.- "gene_scaled": mean expression is independently scaled from 0 to 1 for each gene across the supplied datasets, emphasizing relative expression patterns between datasets. Positive cells are defined as:expression > positive_threshold The positive-cell threshold is explicitly specified by the user because appropriate thresholds depend on the expression scale and preprocessing of the input data. No automatic log/linear transformation is performed. Expression values are used exactly as supplied in the input CSV files.Input CSV format: Each CSV should contain one cell per row and gene-expression values in gene-named columns. Additional metadata or coordinate columns (e.g., cell ID, x, y, z, section information) may also be included. All genes selected for plotting must be present as numeric columns in every input CSV. The software was functionally validated using MERFISH-derived cell-by-gene datasets with multiple cell populations and genes. Expected qualitative differences between canonical D1- and D2-associated gene-expression patterns were reproduced during validation. No third-party MERFISH dataset is distributed with this software. Generative AI (ChatGPT, OpenAI) was used to assist with code generation, refinement, testing, packaging, and documentation. The concept, intended scientific use, validation, and final responsibility for the software remain with the author.
Sora Mitamura· Zenodo (CERN European Organi...· 0 citations
Large Language Models are evolving from code-completion tools into autonomous software agents capable of inspecting repositories, modifying multiple files, invoking tools, executing tests, and iteratively repairing software systems. This increased capability also creates a governance problem: contemporary coding agents are often granted mutation authority far broader than the defect or requirement they are intended to address. This paper extends Generation–Execution Separation from runtime isolation to construction-time governance. It introduces ANS, a governed software construction model in which an LLM may understand the broader system but may mutate only an explicitly authorized subset of its artifacts. Software construction is modeled as a sequence of bounded, evidence-aware state transitions in which the model possesses proposal authority while deterministic infrastructure retains validation and commit authority. The framework introduces four principal mechanisms: Architecture as Capability Boundary, which converts architectural structure into enforceable dependency and modification permissions; Scoped Mutation, which assigns each construction task a finite mutation capability set; Dual-Gate Governance, which separates static structural verification from dynamic execution evidence; and the Freeze–Invalidation Protocol, which protects previously verified artifacts while deterministically invalidating downstream evidence after authorized upstream changes. The paper organizes software artifacts into five construction categories—Model, Provider, Service, Pipeline, and Interface—and distinguishes static dependency topology from runtime control flow. It further argues that these governance restrictions do not inherently reduce computational expressiveness: a Pipeline language supporting assignment, sequential composition, conditional branching, and unbounded iteration can embed a standard WHILE computation model, while effectful Service composition admits a Kleisli-style semantic interpretation under a selected effect model. The central principle is: Knowledge may be global; mutation authority should be local. Under ANS, AI-generated code is not accepted merely because it can execute. A candidate change becomes part of the trusted software state only after satisfying its authorized mutation scope, structural constraints, and required execution evidence.
Zhongren Wang· Zenodo (CERN European Organi...· 0 citations
First public release of assistcurve, the software accompanying the manuscript Assistance curve analysis: evaluating the clinical value of AI-assisted decision making. What it does Assistance curve analysis extends decision curve analysis from prediction models to a clinician working with a model. The central quantity is the net benefit of assistance, ΔNB(p): the difference in net benefit between the decisions a clinician makes with an AI available and the decisions they make without it. Because net benefit is linear in the decisions, ΔNB depends only on the cases where the clinician changed their mind, and reduces to four numbers: ΔNB(p) = [ r_U(π_U − p) + r_L(p − π_L) ] / (1 − p) which gives a break-even rule anyone can apply: follow the AI upward only if more than p of the patients it talks you into treating really have the condition, and downward only if fewer than p of those it talks you out of treating do. The package provides the assistance curve, the switch decomposition, the break-even threshold, the number needed to consult, and an override profile that identifies which part of a model's output range earned its place on the screen. Contents assistcurve/ — the Python package R/assistcurve/ — the R package, with documentation and its own test suite analysis/ — the simulation study, the Collab-CXR analysis, the permutation test, and verify_reported_values.py data/ — derived analysis files figures/ — the six manuscript figures, light and dark Reproducibility 18 Python tests and 22 R tests over 88 expectations. Both suites check properties — the two theorems, the affine form of the curve, the additivity of the override bands — rather than stored output. analysis/verify_reported_values.py recomputes all 144 values reported in the manuscript and exits non-zero on any disagreement. CI runs both suites on Python 3.9/3.11/3.13 and R 3.6/release, verifies the published values, and asserts that the committed derived tables match a fresh run. The R and Python implementations agree to ~1e-16 on every deterministic quantity. Data The applied analysis uses Collab-CXR (Moehring et al., CC-BY 4.0), https://doi.org/10.17605/OSF.IO/Z7APQ. The 36 MB raw file is not redistributed here; data/ holds the derived files, which reproduce every design 2 and design 3 number and every real-data figure. See analysis/HOW_TO_RERUN.md. Licence MIT.
Marwan Alqumbaey, Yousef M. Nasher· Zenodo (CERN European Organi...· 0 citations
SafeCodeBench is a reproducible longitudinal benchmark for evaluating how software security changes across iterative AI-assisted development. It defines 60 base applications across six categories and five staged evolution steps: initial implementation, persistence/data, authentication, integration, and privilege/admin expansion. The full design supports three LLM families and three independent generations per stage, corresponding to 2,700 artifacts and 2,160 revision transitions. The archive provides machine-readable task specifications, standardized evolution prompts, artifact and vulnerability schemas, experiment configuration, SDI computation code, prediction-evaluation scaffolding, dynamic-testing guidance, and a two-reviewer manual-validation protocol. Version 1.0 contains the benchmark/test-bench design and analysis infrastructure; it does not present synthetic calibration measurements as empirical LLM findings.
Halil Dursunoglu· Zenodo (CERN European Organi...· 0 citations
Learning fractions remains a significant challenge in elementary education, often hindered by specific learning obstacles. This study aims to develop GeoGebra-assisted teaching materials integrated with a Hypothetical Learning Trajectory (HLT) to bridge the gap between these obstacles and conceptual understanding. Adopting an Educational Design Research (EDR) approach, the study progressed through three iterative phases: analysis and exploration, design and construction, and evaluation and reflection. The development was grounded in an initial pedagogical analysis of student learning obstacles, which informed the HLT design. Data were collected through expert validation, teacher interviews, and field testing with 161 elementary students (divided into small-scale and large-scale trials), then analyzed qualitatively using retrospective analysis and constant comparative methods.The quantitative results indicate that the GeoGebra-based materials are highly valid (92.75% from media experts) and practical (81.75% in large-scale trials), effectively transforming the HLT into a verified learning path. However, qualitative findings revealed a critical nuance: while students engaged enthusiastically with dynamic visualizations, some faced challenges in transitioning from visual area models to formal symbolic notation. This underscores the necessity of teacher-led instrumental orchestration to scaffold mathematical generalizations. This research concludes that the synergy between dynamic geometry software and a structured learning trajectory provides a robust framework for overcoming cognitive barriers, provided it is integrated within a dialogic instructional environment.
Andhin Dyas Fitriani, - Lea Christina Br Ginting, Harsa Wara Prabawa· Journal of Mathematics Instr...· 0 citations
This paper explores the application of Deep Reinforcement Learning (DRL) to automate software testing. Traditional software testing methodologies heavily rely on predefined rules and templates, often proving inadequate against the complexity and variability of modern software systems. This research proposes a novel approach leveraging DRL to intelligently generate test cases and execute test procedures automatically. The core mechanism involves training a deep reinforcement learning agent to learn optimal testing strategies and methods. The agent learns through trial and error, maximizing reward based on test execution outcomes. We present a framework for implementing this approach, focusing on the challenges and potential benefits of automating the testing process with a learning agent. The results suggest that DRL can significantly improve the efficiency and effectiveness of software testing, particularly in scenarios with high complexity and evolving requirements. This work contributes to the growing field of intelligent software testing and offers a promising avenue for reducing testing costs and improving software quality.
Jincheng Zhang· Zenodo (CERN European Organi...· 0 citations
Code and dataset for DeepThermo-Meta-assisted inverse design of dynamic meta-regulators Description System requirements Dependencies Python 3.11 PyTorch 2.5.1+cu121 torchvision 0.20.1+cu121 Pydantic >= 2.6, < 3 Loguru >= 0.7, < 1 FastAPI >= 0.115, < 1 Uvicorn >= 0.34, < 1 Ollama Python package >= 0.5, < 1 Tested environments DeepThermo-Meta Agent: Windows, Python 3.11, CPU devices Ollama with the qwen3.6 local model tag (optional; model not included in this archive) Inverse-design computation: WSL2 Ubuntu 20.04, Python 3.11, PyTorch 2.5.1+cu121, CUDA 12.1, NVIDIA GeForce RTX 4070 Ti MATLAB: MATLAB (version compatible with RETICOLO V10) - RETICOLO V10 (third-party MATLAB package for RCWA; required for patterned-structure optical simulations and not included in this archive) Other software CST Studio Suite 2025 and a compatible MATLAB environment for joint simulation and validation screening Installation Miniconda conda create -n deepthermo-meta python=3.11 conda activate deepthermo-meta python -m pip install torch==2.5.1 torchvision==0.20.1 --index-url https://download.pytorch.org/whl/cu121 DeepThermo-Meta Agent installation: cd agent python -m pip install -r requirements.txt DeepThermo-Meta Agent operation Path: agent 1. Start the Web Interface python -m uvicorn app.webapp.backend.main:app --host 127.0.0.1 --port 8000 Open http://127.0.0.1:8000 in a Web browser 2. Environment Selection - Selects Arbitrary spectral selection, Temperature resistance, Mechanical flexibility, Corrosion resistance, or Space survivability before entering the design request - Locks the corresponding material preset for an environment-constrained request - Uses preset 3 (colorful) for DMR-1 to DMR-12 under Arbitrary spectral selection when no material is specified 3. Requirement Analysis and Clarification - Parses the natural-language request and extracts the visible and infrared spectral objectives - Requests only the unresolved spectral information and accepts free-form user answers 4. DMR and Material Mapping - Maps the confirmed spectral requirement to one of twelve DMR tasks - Confirms the environment-authorized or project-approved material preset 5. Downstream Input - Generates a structured DMR and material-preset contract for the inverse-design backend - The publication Web interface reports the resolved contract without automatically starting the scientific backend Command-line demonstration (optional) python -m app.interactive_clarify_main "Use DMR-10." --environment arbitrary To enable the optional local LLM, set PUBLICATION_USE_OLLAMA=true and OLLAMA_MODEL=qwen3.6 before running the Agent. Instructions and demo Dataset collection (~15 mins per model) 1. Generate Turing Pattern Database Run TULINpattern.m in MATLAB 2. DMR Generation and Spectral Analysis Run DMR_runing.m in MATLAB - Generates DMR structure modes - Obtains IR spectral responses 3. Optical Analysis Run RCWA_optical_simulation.m in MATLAB with RETICOLO V10 installed. - Calculates reflectivity and transmittance of patterned DMR structures 4. Data Integration and Preprocessing Run data_integrate.m in MATLAB - Integrates DMR results - Normalizes spectral data - Exports processed data for further analysis Dimensional reduction (~1 hour) Path: Dimensional reduction 1. Spectral Data Dimensionality Reduction Run AE_DR.py in Python - Compresses high-dimensional IR spectral data into a low-dimensional latent representation 2. Graphic Parameter Data Dimensionality Reduction Run VAE-main2.py in Python - Compresses high-dimensional DMR graphic parameters into a low-dimensional latent vector that follows a probabilistic distribution This combined latent representation serves as the input for subsequent MCGAN training and generation. Prediction (~1 hour) Path: Prediction Run Simulator_VIS_ref.py - Trains and saves the visible reflectivity prediction module. Run Simulator_VIS_trans.py - Trains and saves the visible transmittance prediction module. Run Simulator_IR.py - Trains and saves the IR emissivity prediction module. Inverse design (~8 hours) Path: MCGAN Run General_GAN_con_VIS_IR.py - Loads the concatenated low-dimensional data and pre-trained prediction modules (Simulators) - Trains the Multi-Conditional Generative Adversarial Network (MCGAN) - Uses TensorBoard to monitor training progress - Saves the trained generator and discriminator models Run General_GAN_con_VIS_IR_test.py - Loads the trained generator model - Performs inverse design for specific targets (DMR-1 to DMR-12) - Outputs the designed DMR parameters and their predicted optical performance Simulation and Validation Path: Validation Run the supplied MATLAB validation scripts - Screens inverse-designed DMR candidates - Performs RCWA optical analysis of patterned DMR structures - Uses CST Studio Suite for high-fidelity electromagnetic validation when the licensed local environment is configured
Shaowen Chen, Yuqian Wang, Haotian Han et al.· Zenodo (CERN European Organi...· 0 citations
PyFgsea 0.2.0 Release date: 2026-09-02. PyFgsea 0.2.0 updates the statistical core used by the high-level Python API and narrows the trajectory interface to functions that are implemented and tested. The paper remains reproducible with its original software pair; current comparisons use a separate, newer reference pair. Highlights mode="aligned" and score_type="std" are the high-level defaults. Aligned mode uses exact pathway sizes (bin_width=0). Gene-ID ordering makes tied ranks deterministic. Unresolved and failed pathways remain visible in the result table. Results include tail-depth, error, termination, approximation, pathway-size, ranking, and algorithm-revision fields. The supported trajectory API is run_trajectory_gsea; unfinished public helpers and the incomplete trajectory CLI have been removed. DPT computation requires an explicit root and preserves root identity when cells are filtered or subsetted. The low-level build_tail_curve and query_tail_curve helpers remain available but are deprecated. They implement the approximate legacy-empirical-tail-v1 method, not the aligned estimator. Reference comparisons The two reference lanes answer different questions and should not be pooled: | Lane | PyFgsea | R | Bioconductor | fgsea | Purpose | | --- | --- | --- | --- | --- | --- | | publication | 0.1.4 | 4.4.3 | 3.20 | 1.32.2 | reproduce the comparison reported in the paper | | current | 0.2.0 | 4.6.0 | 3.23 | 1.38.0 | evaluate the current implementation | On the 100-pathway publication input, the publication lane reproduced the reported values after rounding: ES RMSE 3.84e-16; NES Pearson 0.999967, Spearman 0.999676, and RMSE 0.01333; transformed-p Pearson 0.997199, Spearman 0.988318, and RMSE 0.16960. On the same input, the current lane gave ES RMSE 3.21e-16; NES Pearson 0.999952, Spearman 0.999652, and RMSE 0.01567; transformed-p Pearson 0.999069, Spearman 0.996628, and RMSE 0.11826. A separate 60-pathway tie-heavy case exposes a 0.1.4 limitation. Its legacy NES RMSE was 0.29868; the current implementation reduced it to 0.01558 while restoring machine-precision ES agreement. This sensitivity case was not the publication input. Across 20 fixed score-permutation replicates, the current installed package returned all 2,000 planned null pathways. The pooled mean and median nominal p-values were 0.4991 and 0.5010; the proportions below 0.01, 0.05, and 0.10 were 0.0065, 0.0430, and 0.0935. These are descriptive summaries, not a fitted acceptance threshold. The original speed and memory values are not carried forward because the current run did not measure all tools under one matched scope. Figure 2 scope The accepted trajectory parameters are window_size=500, step=50, nperm_nes=2000, score_type="std", exact pathway sizes, bin_width=0, and NES caching off. The reassembled figure uses a processed 3,576-cell erythroid subset from GSE155254 with precomputed UMAP coordinates and DPT. Panel D ranks genes from scaled adata.X; the frozen object has no separate raw or named log1p layer. Public assignment tables match 2,097 control and 816 gata307mut cells, while 663 cells remain unmatched. The figure pools these groups and is descriptive, not a control-versus-mutant comparison. Benjamini-Hochberg adjustment is performed across pathways within each window and is not trajectory-wide error control. Migration from 0.1.4 The defaults intentionally differ: | Setting | 0.1.4 | 0.2.0 | | --- | --- | --- | | high-level score type | two_sided_abs | std | | estimator | implicit legacy behavior | mode="aligned" | | pathway-size binning | None | 0 (exact size) | | trajectory step | 100 | 50 | | trajectory NES permutations | 100 | 2000 | | trajectory NES cache | on | off | For new analyses, state the numerical contract explicitly: result = pyfgsea.run_gsea( data=ranks, gmt=pathways, gene_col="gene", score_col="score", mode="aligned", score_type="std", bin_width=0, seed=42, ) Install trajectory dependencies with: python -m pip install "pyfgsea[trajectory]" score_type="two_sided_abs" remains available for a bounded legacy-like calculation, but it is approximate and is not equivalent to fgseaMultilevel(scoreType="std"). The Python API does not accept an n_threads keyword. Packaging and paper impact Cargo.toml is the single version source for the Rust crate and Python distribution. Release packages are built as source distribution and platform wheels, installed into fresh environments, and tested through the installed Python package and native core. The two R reference images are also started and checked at runtime. The manuscript review is classified as a numerical and methods correction whose central software-concordance conclusion remains intact. The detailed decision note and claim matrix identify the text and values to keep, qualify, update, or remove. Limits The formal comparison covers the publication input and one predeclared tie-heavy sensitivity case; it is not a universal equivalence claim. Correlation and pathway overlap do not establish algorithmic identity or biological correctness. The Figure 1 run does not provide matched current benchmarks against GSEApy or BlitzGSEA. Runtime and peak memory remain hardware- and scope-dependent. Fast mode and the legacy empirical-tail helpers are approximate.
Kuanghao Wang, Hong Shi· Zenodo (CERN European Organi...· 0 citations
A USAF cadet and a Lincoln Laboratory researcher found AI chatbots can help nontechnical service members produce viable software applications for their unique problems.