Investigating the Software Fault Profile of Industrial Projects to Determine Process Improvement Areas: An Empirical Study and iCharts: Charts for Software Process Improvement Value Management.
The developed e-monitoring and sales reporting system successfully integrated sales and monitoring processes into a single web-based platform and user testing indicated that the system improved reporting accuracy, accelerated information access, and enhanced operational monitoring efficiency at PT.
PT TML Energy, an Engineering, Procurement, and Construction (EPC) company specializing in solar energy projects in Indonesia, experienced recurring project execution delays of 20–40% beyond planned schedules during 2021–2024. A review of project records indicated that these delays stem not from technical limitations b...
Iftikar Fadhlirohman Soeroyo, G. Yudoko· Journal Research of Social S...· 0 citations
The main result is that management methodology has variable significance in different cases of developing three architecture‐based systems in different cases of developing three architecture‐based systems.
Amany A. Slamaa· Journal of Software: Evoluti...· 0 citations
The results provide preliminary evidence that regulatory disqualification logic, particularly K.O. criteria, can prevent the selection of technically competitive models that nonetheless pose unacceptable compliance risks, demonstrating the feasibility of governance-oriented LLM selection in software engineering project...
J. Quintino, H. Moura, Filipe Calegario· 0 citations
This paper’s objective is to propose the Quality 4.0 App implementation framework and, based on it, the application software Quality 4.0 to improve and control the processes and facilitate the transition from a standard to a digital organization. Using quality management tools such as the Define, Measure, Analyze, Impr...
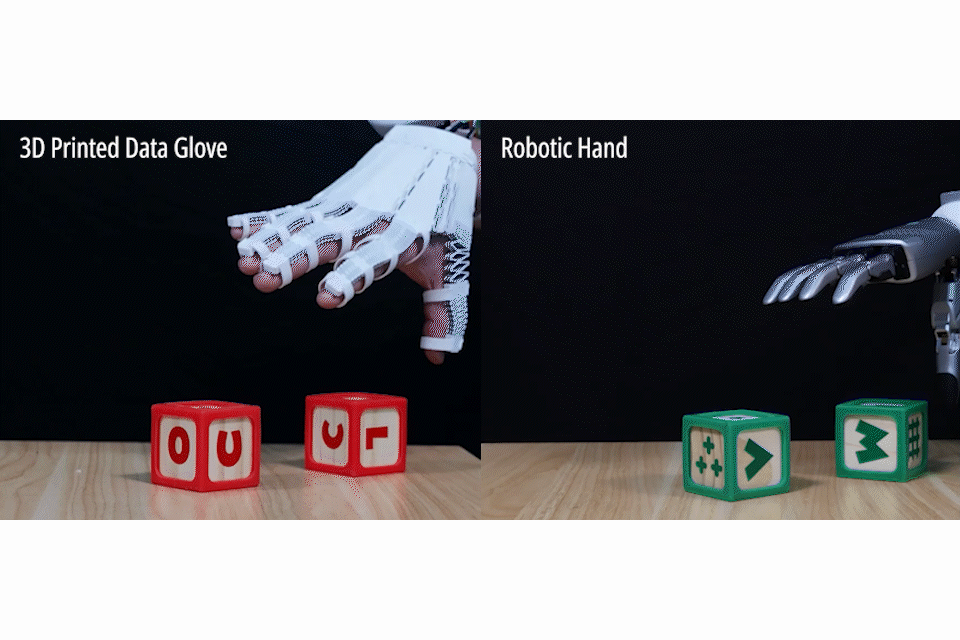
“X-Hinges” helps design and 3D print items like lamps and gloves with an interactive twist: automatically embedded sensors that perceive and adaptively respond to human contact.
Microsoft Research Blog· microsoft.comOct 22, 2026
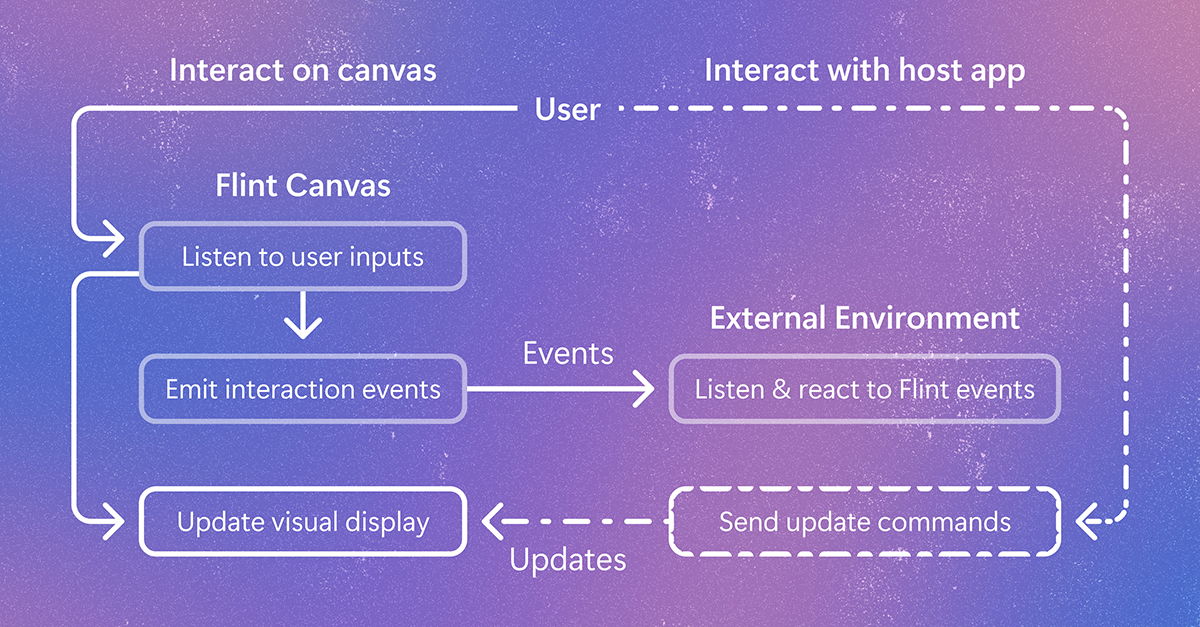
Flint-interactive gives AI agents a language for creating interactive visualizations. Click a chart, filter data, highlight related content, and explore beyond the view the author originally chose. The post Flint-interactive: A language for creating interactive data visualizations appeared first on Microsoft Research.
We use cookies to run the site and, with your consent, for analytics and to show ads.
See our Cookie Policy.